The Secret of HUGE Overnight Income From Government Reports
If you’ve paid taxes, the very idea of the government giving you an opportunity to make money rather than taking away your hard-earned money seems positively laughable…
But it’s not as ridiculous as it seems at first blush. In fact, it’s the cornerstone of one of my favorite strategies to get ahead in the market.
My strategy is devised from the volatility caused after the release of the government’s Job Openings and Labor Turnover Survey (JOLTS)…
That survey makes the overall health of the job market public and, regardless of whether it’s good or bad news, the report always makes the market move… and gives us a chance at huge overnight gains.
I call my strategy the “Zero-Day Loophole.”
It doesn’t matter to us which way the market moves, not with our “Win-Both-Ways Trade”… or with the sheer number of opportunities we have to profit thanks to zero-day options. Not to mention the fact that JOLTS reports are far from the only government economic report that can make the market move.
And I will be detailing all of that in this report so you can finally start profiting from Uncle Sam rather than just paying him a hefty chunk of change every April…
A Surge of Economic Electricity
Now, the JOLTS is, in my view, the strongest government economic report, and it is the focus of our trading. But the government also releases reports on economic data like inflation, GDP growth, the prices of imports and exports, and a handful of other data points year-round like clockwork.
The market always reacts, either positively or negatively, to all of these reports. And with a Win-Both-Ways Overnight Trade set up the night before each report is released, we can profit from all of them…
So let’s take a look at these reports, what exactly is within them, and why they influence the market so strongly.
The JOLTS
First up is the JOLTS (Job Openings and Labor Turnover Survey).
It’s a monthly report from the Bureau of Labor Statistics that counts job vacancies and employee turnover, including layoffs, firings, and voluntary quitting.
The number of job openings and vacancies is considered an indication of demand in the labor market. And ultimately, labor is what drives the economy. Regardless of what a company produces or the services it provides, it needs people to make them or render them.
Low unemployment and high demand for workers can drive wage growth and is generally a good sign for the health of the broader economy. High unemployment means low demand for workers and declining wages and is generally a bad sign for economic health.
Recently, weaker jobs data (or data that was below expectations) was able to push the stock market up – as investors got excited that the Fed could be ending its tighter monetary policy sooner. It’s a bit of a head-scratcher to see the stock market move higher on weaker JOLTS data.
But all of this really doesn’t matter to us.
All that our Overnight Trades need to be successful is for the market to make a big move (up or down). And the JOLTS provides the force needed for a big move on the S&P 500.
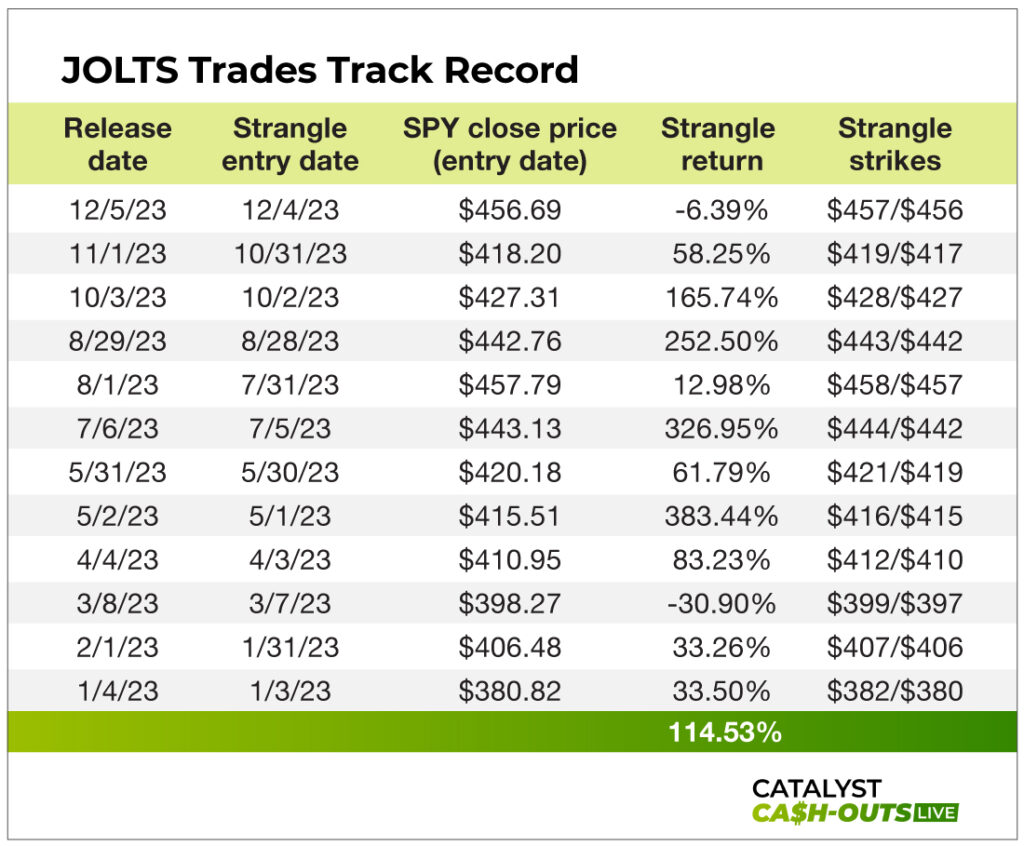
During 2023, Overnight Trades on JOLTS releases had a win rate of 83% with an average return of 114% per win. With 12 of them released each year, that’s 12 chances to more than double your money overnight.
ADP National Employment Report
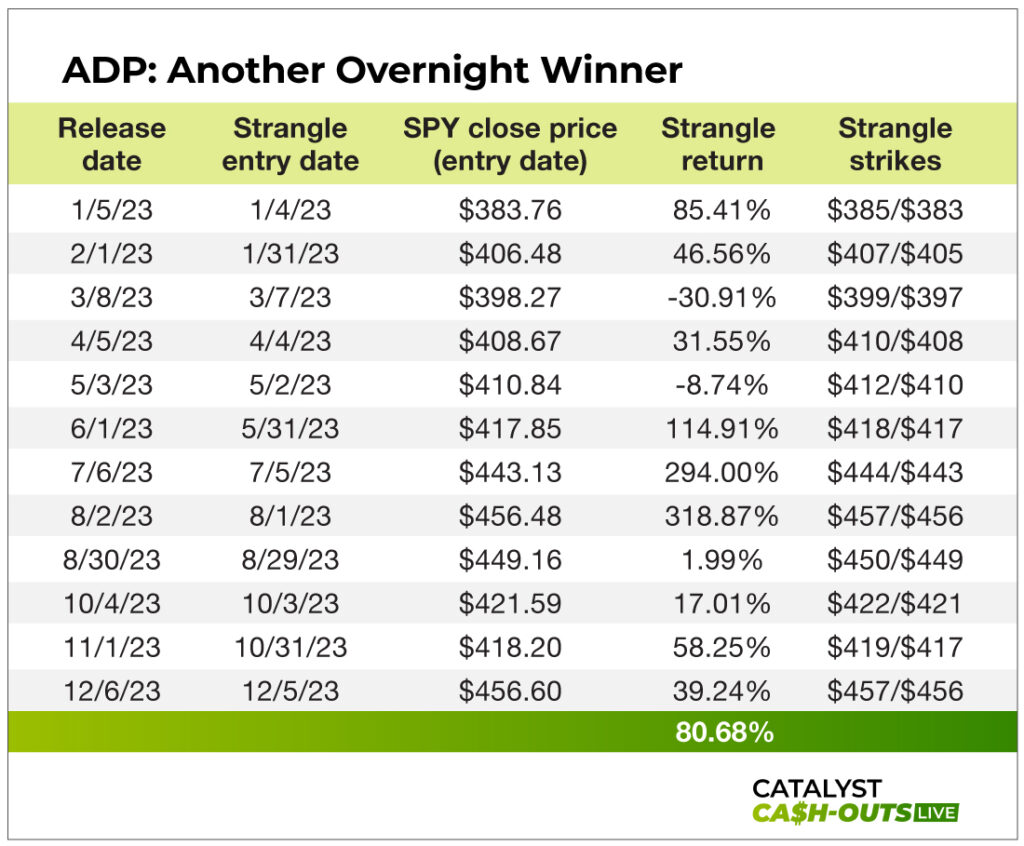
The JOLTS is paralleled by the ADP National Employment Report published by Automatic Data Processing. It’s not a government report, but it tracks nonfarm private employment in the U.S. The JOLTS factors in farm and government employment. The ADP report isn’t as authoritative as the JOLTS, but it can move the market and give us another opportunity for an Overnight Trade.
The ADP saw the same win rate as the JOLTS last year at 83%, which makes sense as it reports on very similar data. The average return of the trades on it in 2023 was 80%. It comes out at the same frequency as the JOLTS, so it’s another 12 chances to lock in some serious money while you’re sleeping.
The Consumer Price Index (CPI)
Up next, let’s take a look at the consumer price index, or CPI, report. It measures the monthly change in prices paid by U.S. consumers. It’s also released by the Bureau of Labor Statistics.
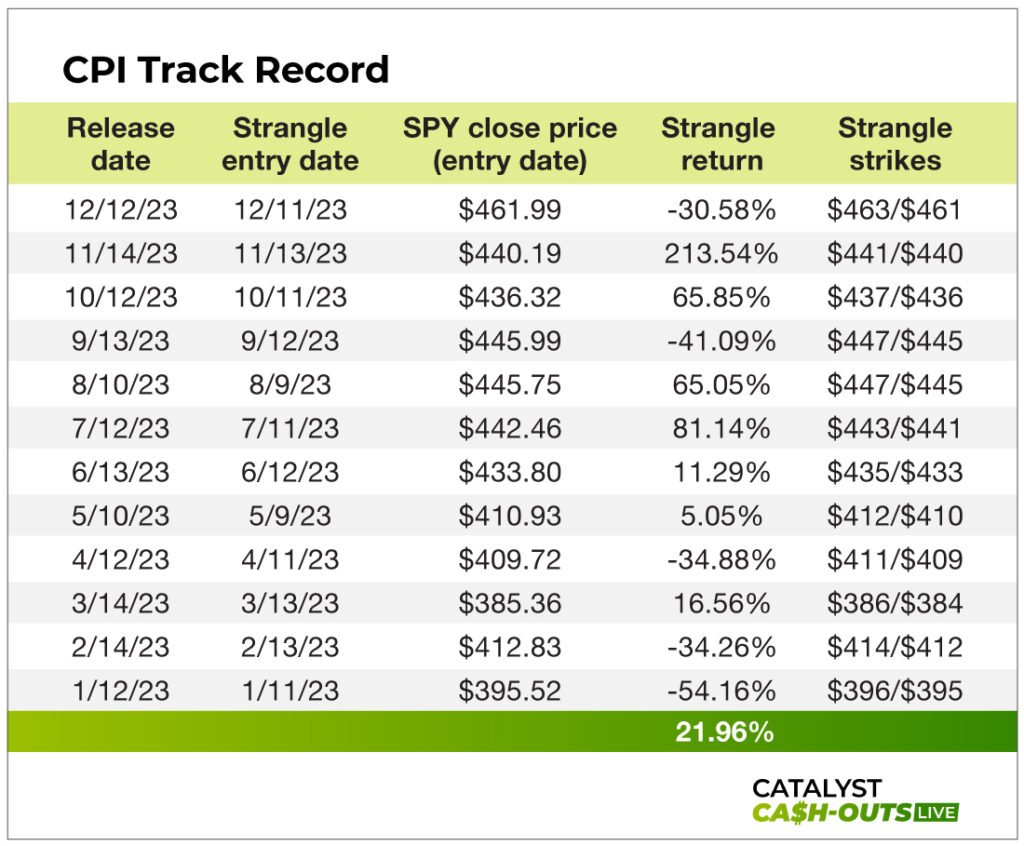
The CPI is a weighted average of prices for a handful of goods and services, ranging from food to fuel, as an aggregate of U.S. consumer spending. It’s a popular measure of inflation and deflation. The CPI report comes out monthly, and Overnight Trades on it in 2023 resulted in a win rate of 58% with an average return of 21%.
It’s paralleled by the producer price index, or PPI, report…
It’s paralleled by the producer price index, or PPI, report…
The Producer Price Index (PPI)
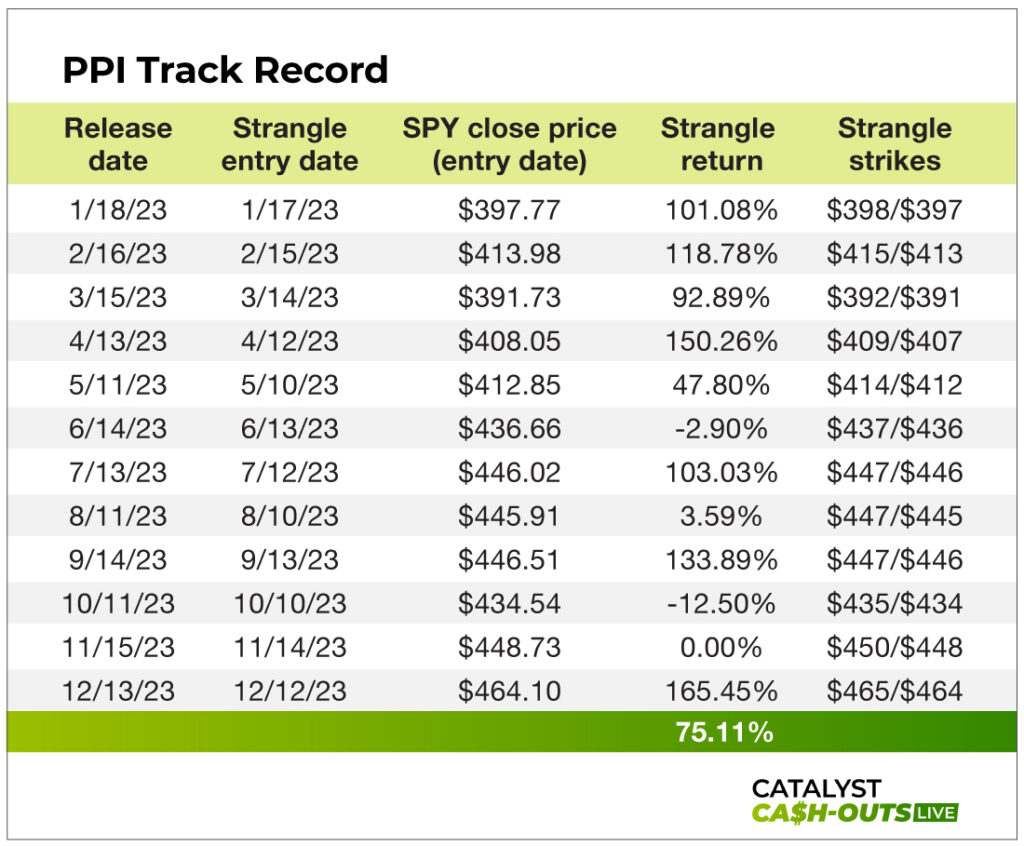
The PPI report measures changes in the prices for U.S. producers of the goods and services the CPI takes into account. For instance, the price of steel for an auto manufacturer or the price of fertilizer for a farmer. The PPI report has a win rate of 75% and an average return of 75%.
If the producers have to pay higher prices for raw materials, the prices consumers pay for the finished product also go up. Broadly speaking, high inflation is bad news for the economy, whether you’re a consumer or a producer, and the market will react negatively as a rule. Low inflation, on the other hand, means declining prices and is generally reacted to positively by the market.
And as you can see, in recent history, PPI has been a stronger report to play. These are the inflation trades we will mainly focus on in Catalyst Cash-Outs Live until the data shifts. There have been times in the past when CPI was the stronger performer. So we will be tracking the data and adjusting our tactics accordingly. Simply based on the reports we’ve covered so far, that’s 48 chances a year to profit overnight!
Gross Domestic Product
Then there’s GDP, or gross domestic product. GDP is perhaps the most widely used indicator of a country’s or region’s economic output. It’s the total value of all goods and services produced within a country’s borders over a specific period, be it monthly, quarterly, or annually.
GDP isn’t a perfect indicator. It’s very much a bird’s-eye view of an economy and so leaves out a lot of factors. But broadly speaking, it’s simple. If the GDP line goes up, we’re in the money. If it goes down, it’s bad news. The market reacts accordingly.
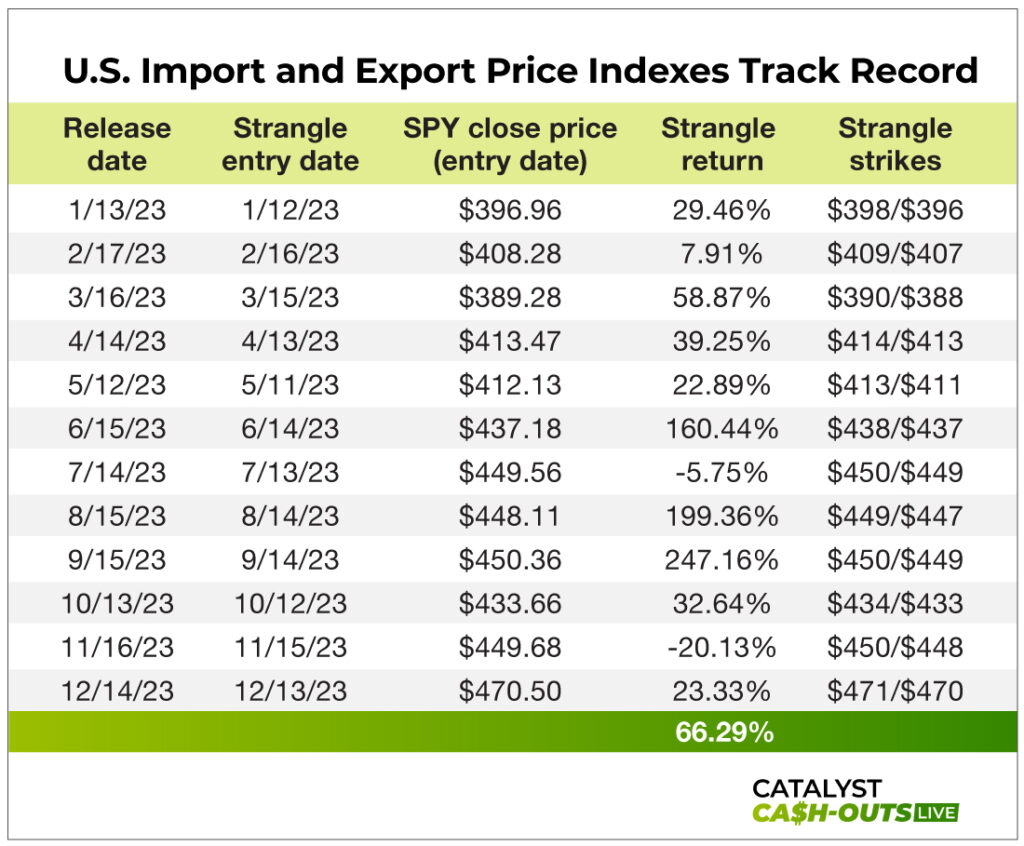
U.S. Import and Export Price Indexes
Next, there’s the U.S. Import and Export Price Indexes. As the name implies, this tracks the change in prices of goods and services purchased from abroad by U.S. consumers and businesses or sold to foreign buyers. It can measure a few different things for the market – for example, the impact of foreign inflation on American producers and consumers – and provide a more accurate view of the government’s trade statistics (normally inflated due to the use of nominal dollar terms).
This report comes out monthly, and trades on it in 2023 had the same win rate as plays on the JOLTS and ADP reports, 83%, and an average return of 66%.
Trading on the Fed
Finally, let’s talk about the Federal Reserve. Established by the Wilson administration’s Federal Reserve Act on December 23, 1913, in response to the Panic of 1907, the Federal Reserve Bank is the most important institution in the American economy.
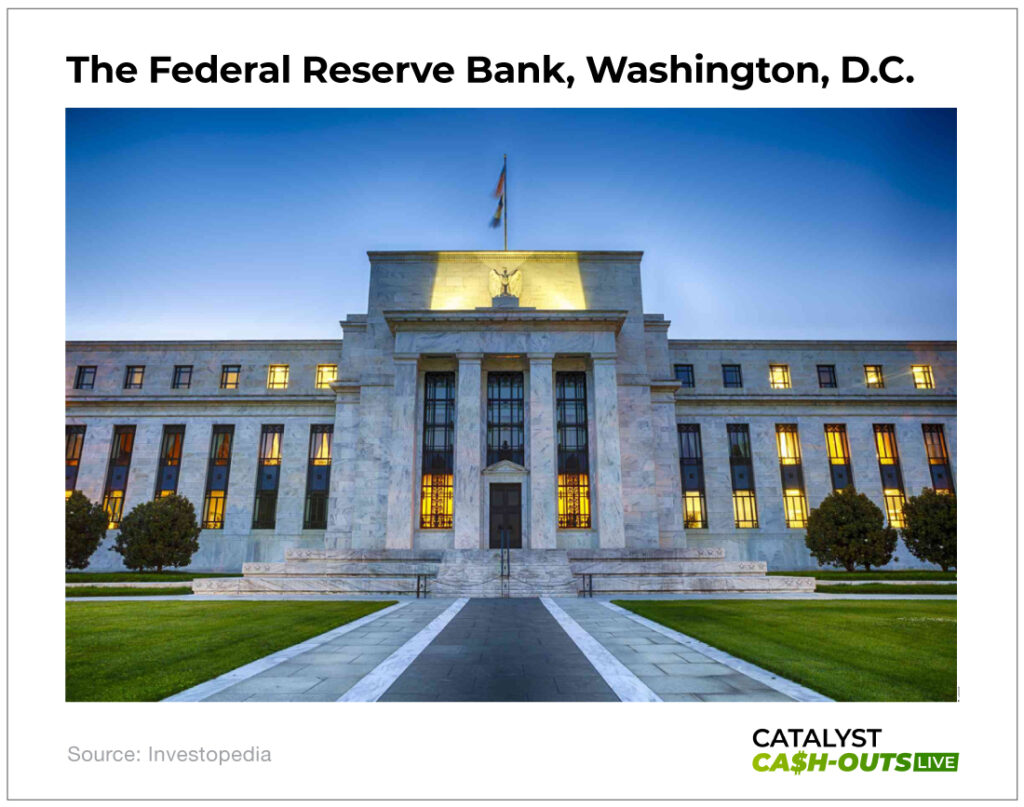
Despite that fact, the government’s only real control over the bank is setting the salaries of its directors. The bank considers itself an independent central bank because its monetary decisions do not have to be approved by the president or anyone else in the executive or legislative branches of government. It is not funded by Congress, and its head, the chairman of the bank, is chosen by its board of directors.
Regardless, the Fed and its 12 constituent branch banks around the country oversee the country’s monetary system and policies. The most important lever it has to influence the economy is the interest rate. The Fed sets the rates at which most other banks lend out money. It impacts business loans, car loans, mortgages, the works…
It also controls the money supply, which effectively gives it a lot of control over inflation. Increasing the money supply increases inflation, which is brought under control by raising the interest rate.
The Fed’s FOMC, or Federal Open Market Committee, is made up of the Fed’s board of seven governors and the heads of the New York Reserve Bank and four of the remaining 11 regional reserve banks.
It meets eight times per year, and the changes it makes to the interest rate and the money supply influence the market. The market reacts to that data, and it usually causes a big move one way or the other…
In 2023, making an overnight play on the Fed meeting led to a win rate of 100% and an average return of 101%. That’s as close to a sure thing as you can get in the options market.
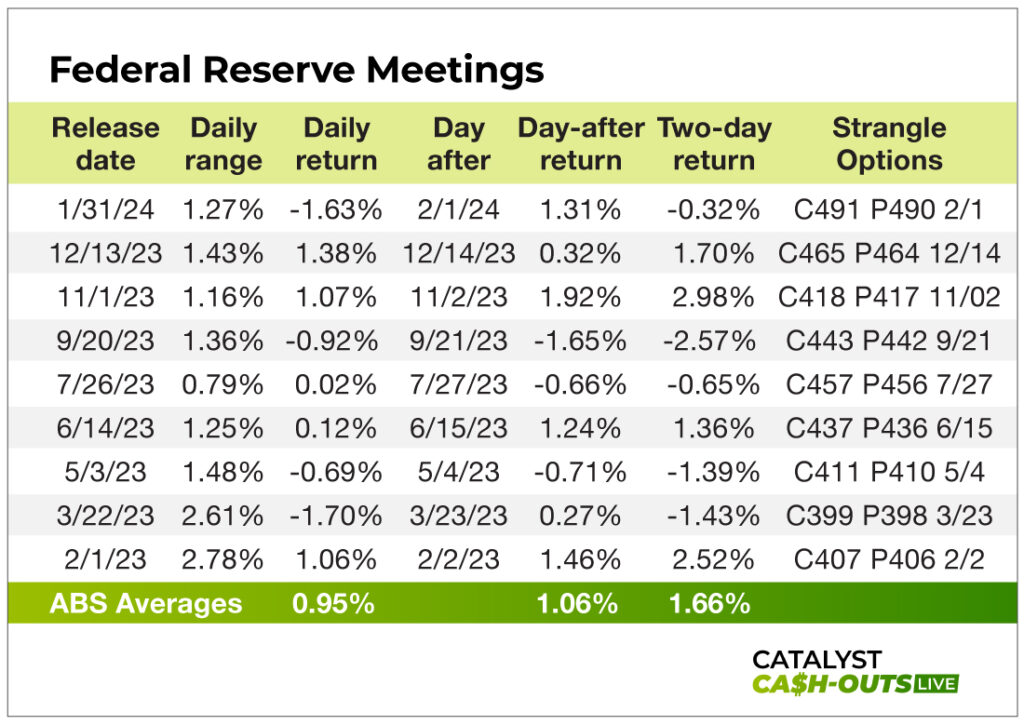
This is the power of this trading strategy. Now, let’s take a look at how we’ll be capitalizing on all of these releases: zero-day options.
Zero Hour
Now, if you know a thing or two about options, you’ve likely heard about monthly options. These are the oldest form of options, and they expire on the third Friday of every month.
But an increase in demand for options trading led to the creation of weekly options. These expire every Friday throughout the year.
And in the last few years, a huge increase in options trading and demand for more options led to the creation of the “zero days to expiration,” or 0DTE, options. These expire every day throughout the year…
The variety of options on the modern market gives us the opportunity to trade options that expire every day the markets are open. This makes it possible for us to place an Overnight Trade to profit off of the reports released by the government and the Fed each and every month.
And we can do it right before any report release with the lowest option cost possible thanks to 0DTE options – which carry a lower premium than options expiring later in time.
If you don’t know anything about options, you can refer to my in-depth options guide here.
But so you can understand the Win-Both-Ways trade, I’ll give you a short explanation of them now.
In short, an option is a contract. It gives its holder the right – but not the obligation – to buy or sell 100 shares on a designated date and at a specified price, called the strike price.
Options come in two varieties, calls and puts.
Call options are contracts that give their holders the right – but not the obligation – to buy shares at a certain price.
It’s essentially a bet that the price of the underlying stock will rise above the option’s strike price by expiration and the contracts will give their owner the ability to buy at a discount.
When that happens, those calls are referred to as “in the money.” If a call option’s strike price is above the price of its underlying security, it’s referred to as “out of the money.”
Put options are the opposite of calls.
A put option is a contract that gives its holder the right – but again, not the obligation – to sell shares at a predetermined strike price.
It’s a bet that the price of the underlying stock will sink below the option’s strike price and the contracts will give their owner the ability to sell at a premium.
Basically, options allow you to magnify moves in the stock market. With options, you can turn a 5% move in a stock’s share price into a 50%, 100%, or even 500% options gain.
And the option we’re going to be trading primarily is under the symbol SPY: the SPDR S&P 500 ETF Trust. It’s an ETF that tracks the S&P 500 Index. The S&P 500 is made up of the 500 largest stocks on the American market and is one of the best indicators of the general direction of the market.
Whenever one of the reports I mentioned above is released, it’s the S&P 500 Index that will best reflect the market’s reaction and allow us to profit from it.
But how will we be “winning both ways”? The answer is a type of options play called a strangle…
Stranglehold
In simple terms, you set up a strangle by simultaneously buying an out-of-the-money call option and an out-of-the-money put option with the same expiration date on the same stock.
This establishes a position that theoretically has unlimited profit potential on the upside and limits any downside losses to a predetermined amount – the amount you spent on the options.
Set it up correctly, and you’ll have a balanced position of calls and puts on the same underlying asset on the same expiration date, but with different strike prices. Getting positioned on both sides of a trade like this forms a strangle.
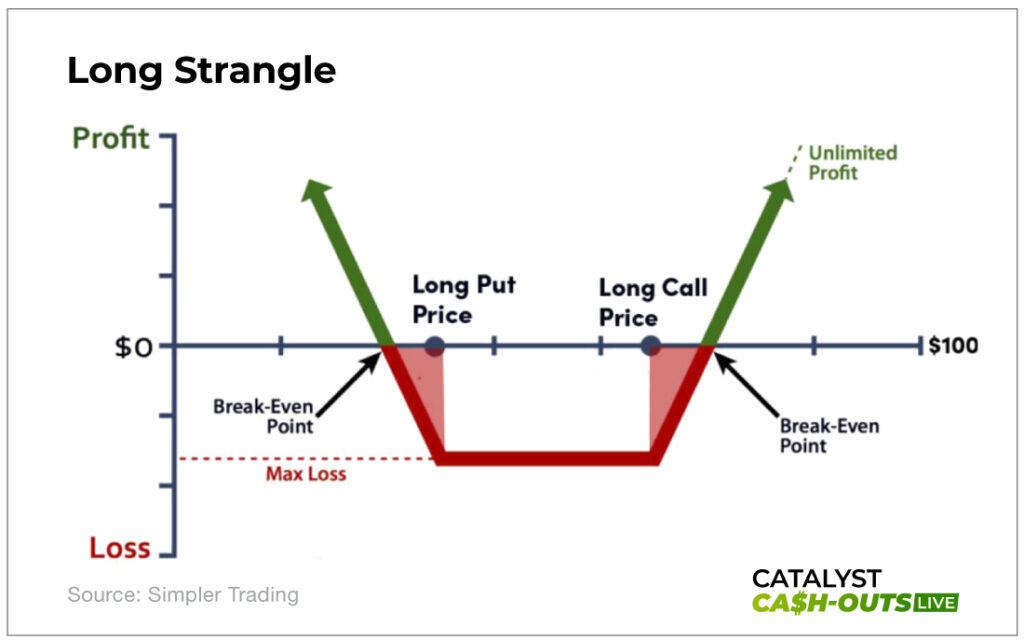
The goal is to profit from a big reaction to one of the government or Fed reports in either direction, up or down. When executed correctly, you’ll profit from a sizable reaction without even knowing the direction.
Here’s how that looks in practice…
Let’s say that the SPDR S&P 500 ETF Trust is trading at $522 a share and a new JOLTS report is scheduled to come out on March 6. You want to take advantage of both the “Win Both Ways” trade and zero-day options.
You establish a strangle on March 5 by buying the following zero-day options…
You buy the ETF’s $523 calls that expire on March 6. You also buy the ETF’s $521 puts that expire on March 6. Those prices are just above and below the share price at the time you set up the strangle…
Let’s say the call costs you $1.69 per share, or $169 for the whole contract, and the put runs you $0.74, or $74 for the whole contract, so your total cost to set up the strangle is $2.43 per share, or $243.
Now, you don’t know whether the report will be good or bad news for the market, but if the S&P 500 Index and, by extension, the ETF that tracks it make a big move, the direction won’t matter. This play will still turn a profit.
So say the JOLTS report shows very low unemployment and rising wages and the ETF jumps from $522 to $532.44 as the S&P 500 rises, which is a 2% gain (and a large move for this ETF). Because of this, your calls are now worth $944 while your puts expire worthless.
Take your $944 gain when you sell the call option (there’s no gain on your puts as they are now worthless) and subtract your entry cost on the strangle ($243), and you have a total gain of $701 on the trade. That works out to a 288% gain overnight!
($944 – $243) / $243 = 288.48%!
In this scenario, your options transformed a 2% gain in the ETF into a 288% gain.
That’s because the substantial gain from the calls far outweighed the complete loss from the puts. You took home a triple-digit winner on the JOLTS move without even knowing whether it would move the market up or down.
In sum, executing the strangle has the following distinct advantages.
The move: Reactions to government reports are often responsible for the largest single-day moves an index will make. And that’s precisely when you want to be involved because that’s when the money is made.
The timing: You know ahead of time the exact timing of every trade you’re going to make. That’s because all of these reports are scheduled, and we will know exactly when they’re due to be published. This allows you to plan your entry and exit orders accordingly. There’s zero guesswork when you have zero directional risk.
When the government releases economic data, most traders swing for the fences and speculate on only one direction, up or down.
Sometimes they win, and other times they lose. But it’s always a coin flip. Over time, they’re unlikely to come out significantly ahead.
But with strangles, you remove that guesswork. When you play both directions together, all you care about is whether the market moves big in either direction on the day.
When done correctly, as long as the market moves up or down significantly, you’ll win. In the process, your chances of success will increase significantly and the likelihood of a 100%, 200%, or even 450% return remains in your favor.
Taking Advantage of the Zero-Day Loophole
By making the Win-Both-Ways trade on the S&P 500 ETF the night before the government releases some new major economic data through a JOLTS, CPI, or other market-moving report, we can bank big profits several times a month.
And you can keep track of all of those releases on our Overnight Profits 2024 Calendar here. The calendar keeps track of JOLTS, ADP, CPI, and PPI reports as well as FOMC meeting announcements. Pick any month at random, and you’ll be looking at more than four releases – four chances for overnight profits.
For once, Uncle Sam is giving us a chance to make serious money rather than taxing it away at every available opportunity. And the best part is it doesn’t matter whether the government releases good or bad news.
No matter which way the data pushes the markets, we come out on top. It’s the best way to play the government’s scheduled releases.
Of course, you don’t have to place these trades on your own, especially if you are just getting started with options.
We will be trading on these major government reports multiple times a month in Catalyst Cash-Outs Live. If you have yet to log in, go here.
And remember… We host our live sessions to cover trades just like this – and other fast-moving opportunities – every Tuesday at 2 p.m. ET.

