If you’ve ever stared at a stock chart and asked yourself:
“Should I buy now… or wait?”
You’re not alone.
It’s the one question that haunts every investor — from total beginners to seasoned pros.
And it’s the exact problem the Perfect Timing Indicator was built to solve.
This tool doesn’t rely on guessing, gut feelings, or CNBC noise.
It’s a custom-coded visual overlay you can paste right into a free TradingView account — and it literally flashes a green arrow on your screen when bullish momentum is starting to build.
No guesswork. No complexity. Just clear visual cues telling you:
“Momentum is on your side. Now’s your window.”
The Perfect Timing Indicator backtest found countless winning trades in 2025 — across stocks, ETFs, even gold and crypto.
It flagged setups before massive moves. And if you had amplified these returns with a special trade, you could have seen
- 📈 334% on Philip Morris in 4 months
- 🥇 748% on gold in 3 months
- 🔋 1,191% on Excelon in 3 months
- 🎯 And up to 1,611% in 4 months on Netflix
Not only that — it includes optional red arrows that signal when momentum is fading.
These red arrows can help you make smarter exits…
Give you this signal to sit on your hands before picking up more shares of your favorite stocks, …
Or tell you it could be an opportune time to short a stock or the markets.
Best part? You don’t need to know code, charts, or even trading lingo.
In this guide, you’ll learn exactly how to install The Perfect Timing Indicator, so you can start upping your trading game.
Let’s walk through it, step by step.
Adding The Perfect Timing Indicator
Step 1: Get A Free TradingView Account
First, go to TradingViews website here: https://www.tradingview.com/
You can set up a free account or purchase a subscription. But any free account gets to have two chart indicators at not cost.
And of course, one will be The Perfect Timing Indicator!
(Affiliate disclaimer: If you decide to go with one of their (optional) premium plans, they’ll send us a commission if you click our referral link (above). Thank you for supporting our content.)
When you land on the TradingView home page, click the “Get Started” button in the top right corner:

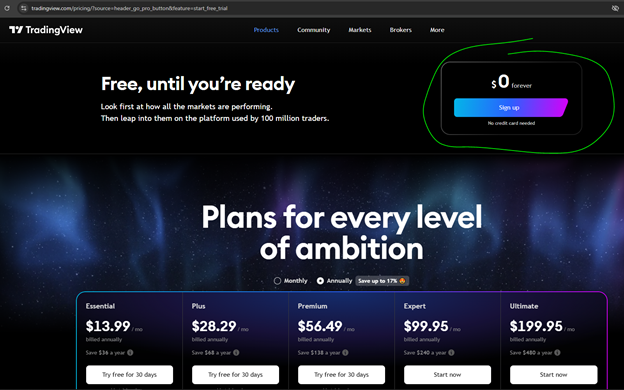
Once you click “Get Started,” you will land on the page to select the plan you want.
If you want a paid account with more bells and whistles, select from the options at the bottom of the page.
But if you want a free account, click the “$0 forever” option in the top right corner:
Once you click “$0 forever,” you can setup your free account by signing in with Google, Facebook, X, yahoo, Apple, Linked in or by the email address you want to use:
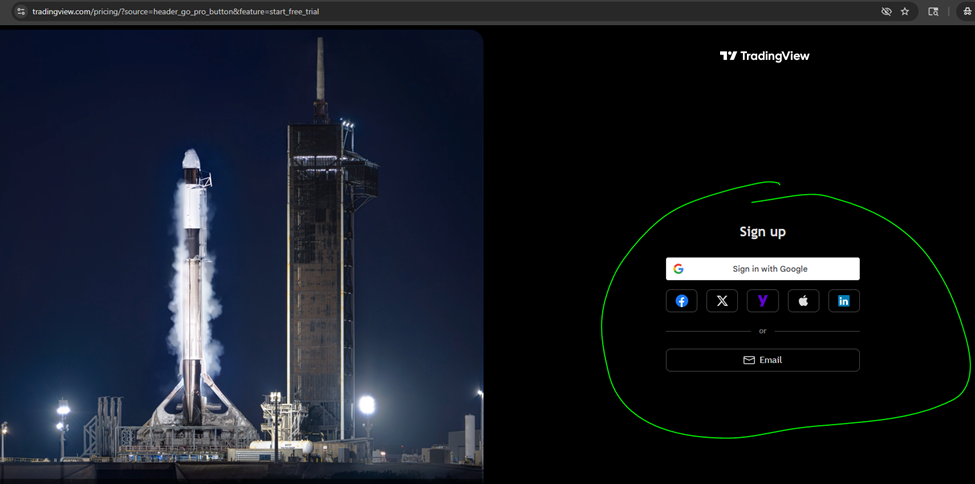
Selecting email is a simple way to get started.
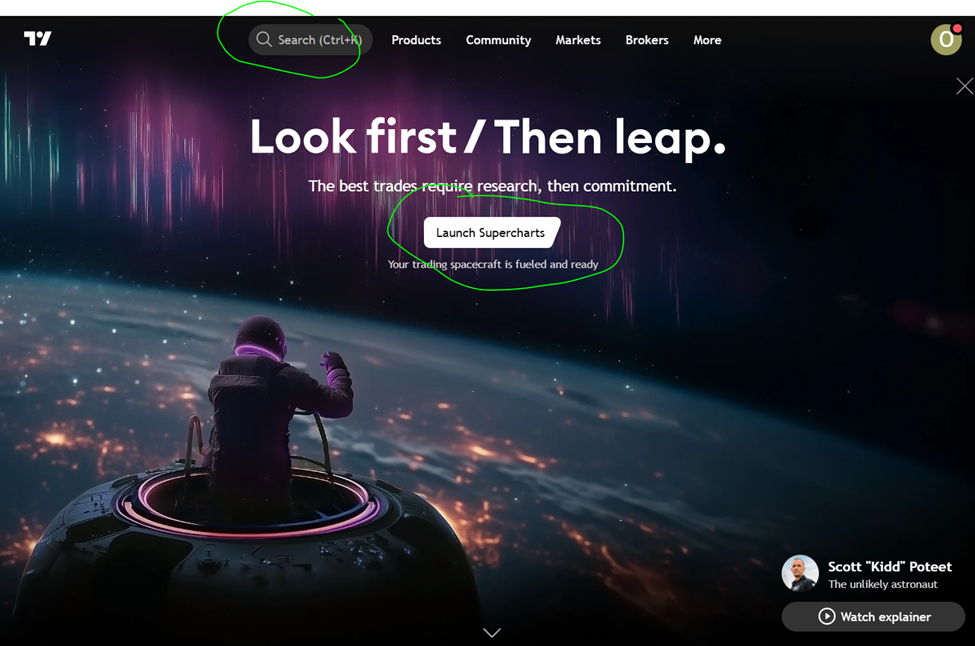
Step 2: Launch Super Charts
Once you set up an account, you can click on “Launch Supercharts” or type in a stock ticker symbol to load a chart with the search feature at the top of TradingViews website:
In this example, I have SPY (a popular S&P 500 index ETF) chart:
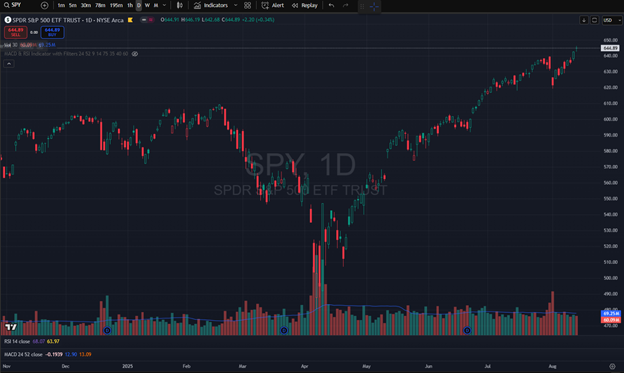
Step 3: Copy and Paste the Perfect Timing Code
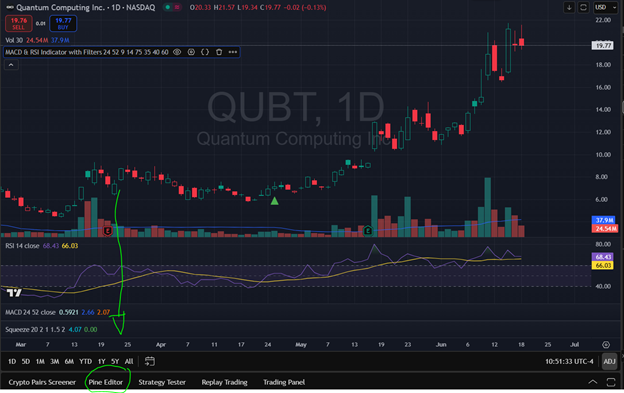
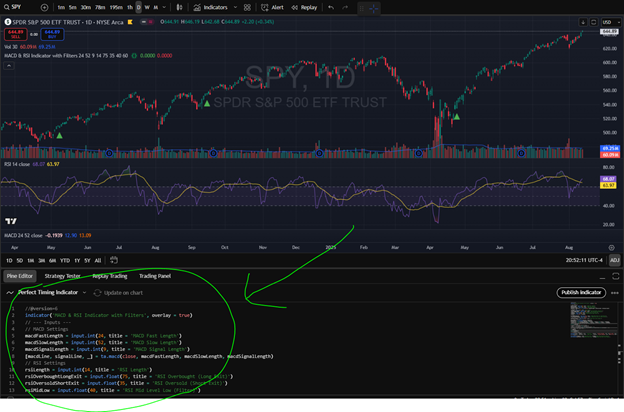
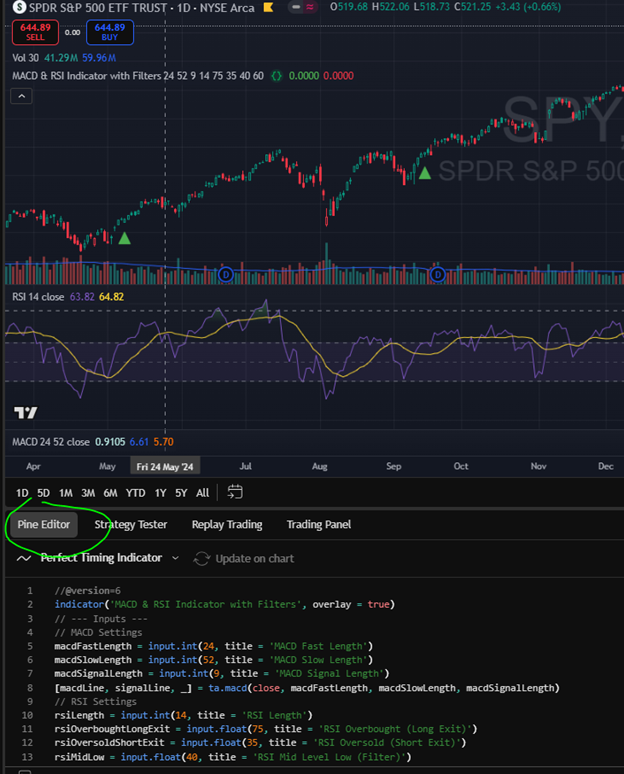
Once you have a chart loaded, look for the Pine Editor tab on the bottom and click on that:
A window will pop up. Remove all the code listed there, and replace it with this code. (Copy and past this code below):
 //@version=6
indicator('Cash Code X', overlay = true)
// --- Inputs ---
// MACD Settings
macdFastLength = input.int(24, title = 'MACD Fast Length')
macdSlowLength = input.int(52, title = 'MACD Slow Length')
macdSignalLength = input.int(9, title = 'MACD Signal Length')
[macdLine, signalLine, _] = ta.macd(close, macdFastLength, macdSlowLength, macdSignalLength)
// RSI Settings
rsiLength = input.int(14, title = 'RSI Length')
rsiOverboughtLongExit = input.float(75, title = 'RSI Overbought (Long Exit)')
rsiOversoldShortExit = input.float(35, title = 'RSI Oversold (Short Exit)')
rsiMidLow = input.float(40, title = 'RSI Mid Level Low (Filter)')
rsiMidHigh = input.float(60, title = 'RSI Mid Level High (Filter)')
rsiValue = ta.rsi(close, rsiLength)
// Filters
filterRSILongEnabled = input.bool(true, title = 'Enable RSI Filter for Long Entries')
filterRSIShortEnabled = input.bool(true, title = 'Enable RSI Filter for Short Entries')
// User Option to Enable Short Signals
enableShortSignals = input.bool(false, title='Enable Short Entry Signals')
// --- Entry Conditions ---
macdLongEntry = ta.crossover(macdLine, signalLine)
macdShortEntry = ta.crossunder(macdLine, signalLine)
rsiLongFilter = not filterRSILongEnabled or (rsiValue > rsiMidLow and rsiValue < rsiMidHigh)
rsiShortFilter = not filterRSIShortEnabled or (rsiValue > rsiMidLow and rsiValue < rsiMidHigh)
longEntry = macdLongEntry and rsiLongFilter
shortEntry = enableShortSignals and macdShortEntry and rsiShortFilter
// --- Plotting Signals ---
plotshape(series = longEntry, title = 'Long Entry', location = location.belowbar, color = color.green, style = shape.triangleup, size = size.small)
plotshape(series = shortEntry, title = 'Short Entry', location = location.abovebar, color = color.red, style = shape.triangledown, size = size.small)
// --- Alerts ---
alertcondition(longEntry, title='Long Entry Alert', message='MACD & RSI Long Entry Signal')
alertcondition(shortEntry, title='Short Entry Alert', message='MACD & RSI Short Entry Signal')
Paste it and hit save.
Hit “add to chart” and it will also prompt you to save the indicator.
You can call it whatever you want, but of course, we like The Perfect Timing Indicator!
Now close the tab by clicking the “Pine Editor” tab again.
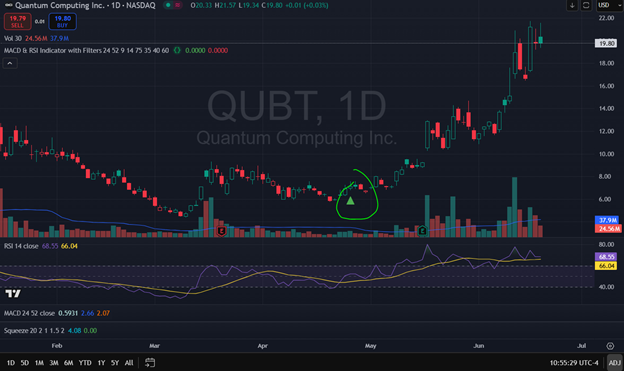
The new indicator should show up on you chart. With green arrows like this:
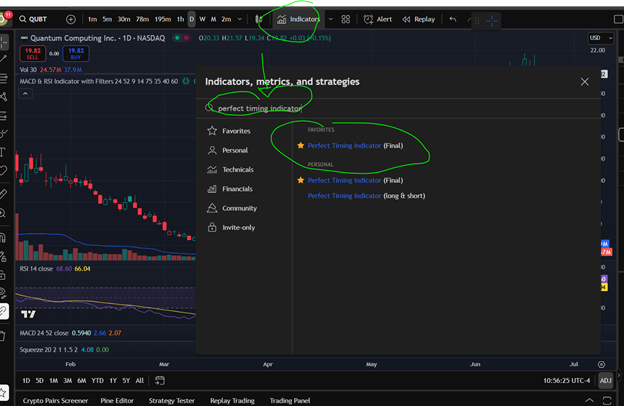
If its not there, click on indicator and search to add it:
From there, you should be all set.
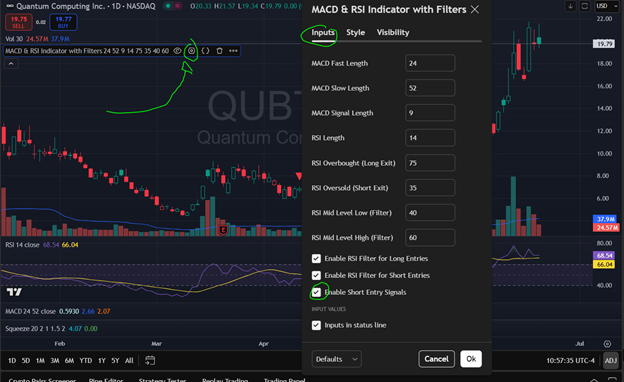
And if you want to turn on red arrows that give you “short signals” or exit point ideas do so by clicking the setting button. The under signals, click check box on “Enable Short Entry Signals.” Red arrows will also now appear on your charts:
From here you should be all set.
Step 4: Have More Questions? Get Answers Live
If you have more questions or need some more assistance, we got you!
Our Moderators are available for live chat 9 a.m. to 4 p.m. Eastearn any day the markets are open.
Simply go to mtacommandcenter.com click the Mod Chat tab on the left.
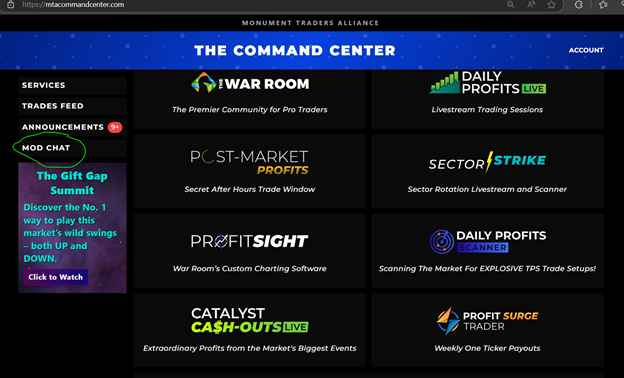
From there, you chat with our moderators in real-time.
But don’t forget… you now have full access the Catalyst Cash-Outs Live.
Step 5: Come to Your First Catalyst Cash-Outs Live Session
Every Tuesday at 2 p.m. Bryan Bottarelli goes live with his trading partner, Karim Rahemtulla, to give you’re their top trade idea for the week.
And best believe… The Perfect Timing Indicator will be used many weeks for new trades.
So, if you have more questions or want to see how a Pro Trader uses this indicator in action…
Join Catalyst Cashouts Live every Tuesday at 2 p.m. EST.
Bryan will answer your Perfect Timing questions live and walk through the green-arrow trades he’s watching for the week. Bring your tickers—we’ll apply the indicator together!
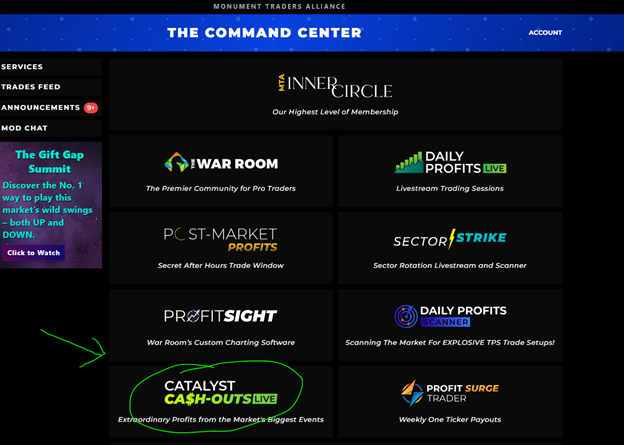
You can access Catalyst Cash-Out Live here with the email address you used to sign up for The Perfect Timing Indicator: https://watch.catalystcashouts.live/
Or you can access it from your Command Center at mtacommandcenter.com:
You’ve now got a clean, rules-based way to trade momentum—green for go, red for caution, with alerts so you don’t miss the move.
Start using the Perfect Timing Indicator to turn hesitation into a repeatable edge: defined entries, disciplined exits, and no more “is now the time to buy?” guess work.
You will instantly see that this indicator is a game changer for your portfolio.
Now that you have added to your charts and in your trading arsenal, we look forward to seeing you every week in Catalyst Cash-Outs Live.
See you on the stream!
Bryan Bottarelli and The MTA Research Team